


The Markets
SPX
After moving lower by 10%, the S&P tested into the secondary 23.6% at 5,520.65 on Thursday. This price point offered plenty of demand with the market bouncing over 120 points off the test. The question now becomes, have we found a floor for the long-term or have we simply paused the descent for now.
As I am sure is no surprise, the current market is dominated by negative gamma, and in such an environment, we are exposed to higher volatility. A lot of this negative gamma is attached the the options which are set to expire this coming Friday. Said another way, while we may still in the short-term be poised for volatility, there is a chance that after this week passes we find relief, assuming of course, that negative gamma is not carried forward after this expiry.
As we look forward to the current week, we actually have quite a few events that carry their own event volatility.
Tuesday AM: VIX Options Expiry
Wednesday Afternoon: FOMC
Friday AM/PM: SPX Expiry AM, Single Stock Options Expiry
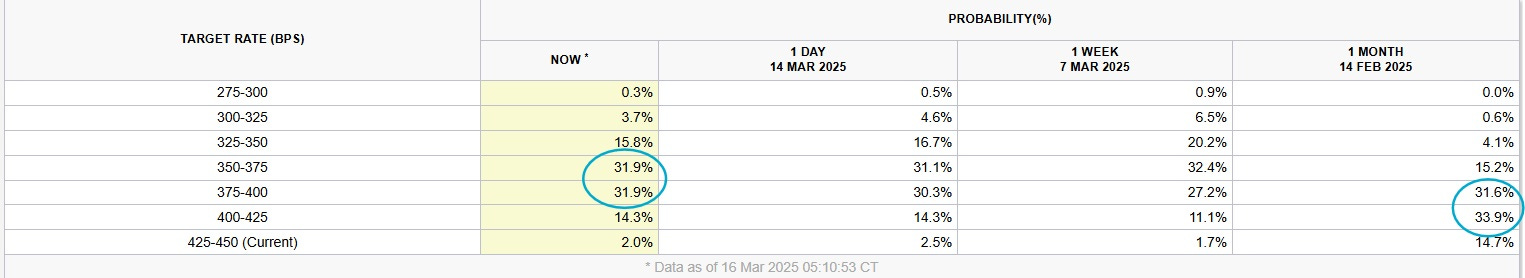
While all of these carry their own significance, I think the most important will be the statements by Jerome Powell at the FOMC. Given the current political and geopolitical landscapes, there could be a potential for the Federal Reserve’s hand to be forced into additional rate cuts, or even pausing quantitative tightening. And while Opex will affect the markets in the short-term, the Fed’s decisions have a lasting impact. Below we see the December 2025 Target Rate Probability. A month ago, the assumption was 1-2 hikes, now it is 2-3 hikes.
There is one last thing to note before diving into charts, and that is the JPM collar. We are currently trading near to the long puts of the collar which is at 5,565. We know that opex is going to free up a lot of negative gamma, but the question is, can the market generate enough momentum to get far enough away from 5,565 before the gamma at that price becomes sticky as we near the date of expiry of the collar, the 31st.
There are a lot of moving parts to consider, and these are only the ones we know about. There is no way to know what will be said or done at any moment, and as such the volatility is likely to remain in place. To really assume a potential longer-term bottom setting up, we would want to see VIX back under 19/20. Now let’s talk charts:

After dropping over 10% the SPX finally tested into the secondary 23.6% at 5,520.65 and bounced over 140 points. This has created a potential consolidative zone from 5,520-5,656 (tertiary 23.6%) as we head into Friday’s opex, which has a key gamma strike at 5,600 (sticky). And if the SPX were to test 5,656.35, it would put the trailing support at 5,565, just on top of the JPM Collar; a lovely confluence.
Outside of the consolidation option:
We would need to see price above 5,656.35 for an option to the tertiary 38.2% and downtrend near 5,750.
If price were to break below 5,520.65, it would open to 5,450 and then 5,132.
NDX (Nasdaq)
After dropping some 14% the NDX too found support at the support pocket from the secondary 23.6% and the tertiary 61.8%, from 19,264-19,442. This area should be treated as major support, and as such if lost, it is a major risk. In addition, the point of control from the move lower is now at 19,600. This is the first time the market has been above the short-term point of control since the move down started, this in itself may too offer some buoyancy to the market, as short-term control is being taken by the bulls.
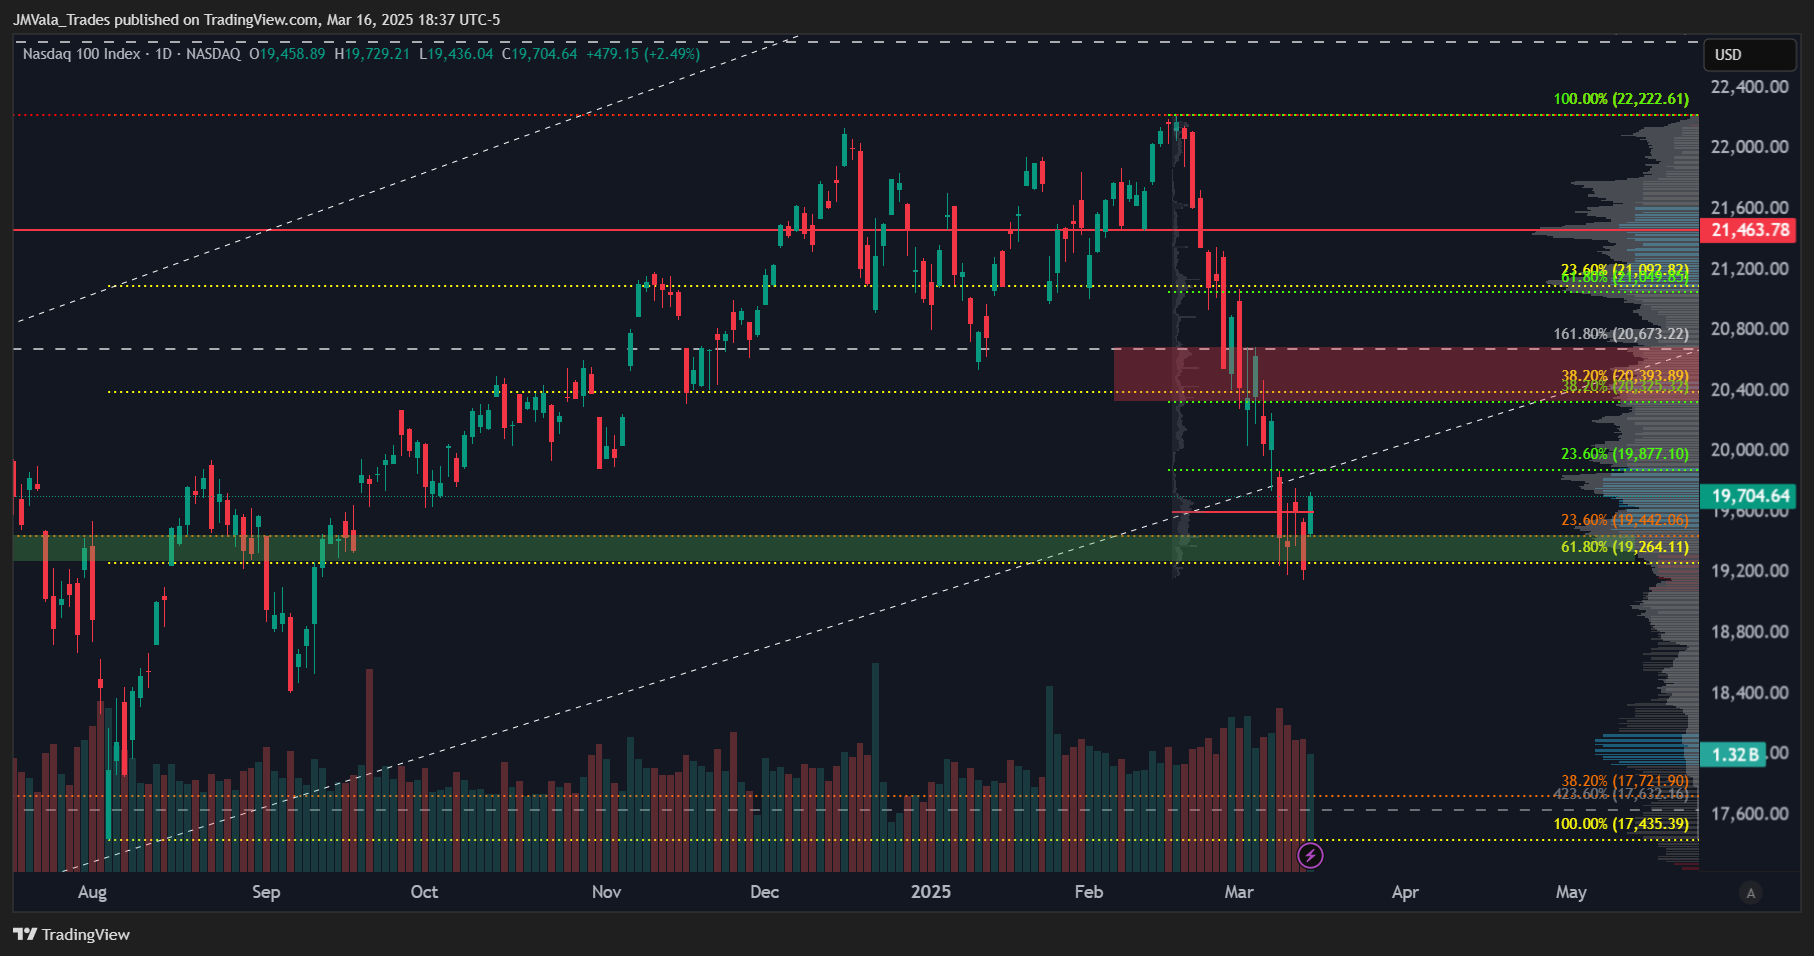
The volume profile shows us that we are currently in a high-volume node, and it fits quite neatly into the range of our above mentioned support and also the 4th-term (green) 23.6% at 19,877 offering our consolidation range for this market.
Elsewise:
If price moves above 29,877 it offers to 20,325.
If price moves under 19,264 it opens the potential down to 17,721.
VIX
Lastly, a bit on the VIX.
The last couple of times that the VIX hit the primary 23.6% at 28.35 (or exceeded it), it pulled back immediately and marked a high to the Index for a measurable period of time. This is what we want to see moving forward. However, given the amount of issues currently within the political environment, one would conclude it would be more difficult for the index to drop than other times.
On the chart below, you see a tertiary retracement struck in yellow, and that 61.8% at 19.14. This is the level we will want to see the VIX below if this is truly a bottom.

Another quick note is that while the April (next month) call wall remains at 20, there is a considerable amount of volume consolidating in the mid to upper 40’s which may create the ability for the call wall to shift much higher.
Top-Weights
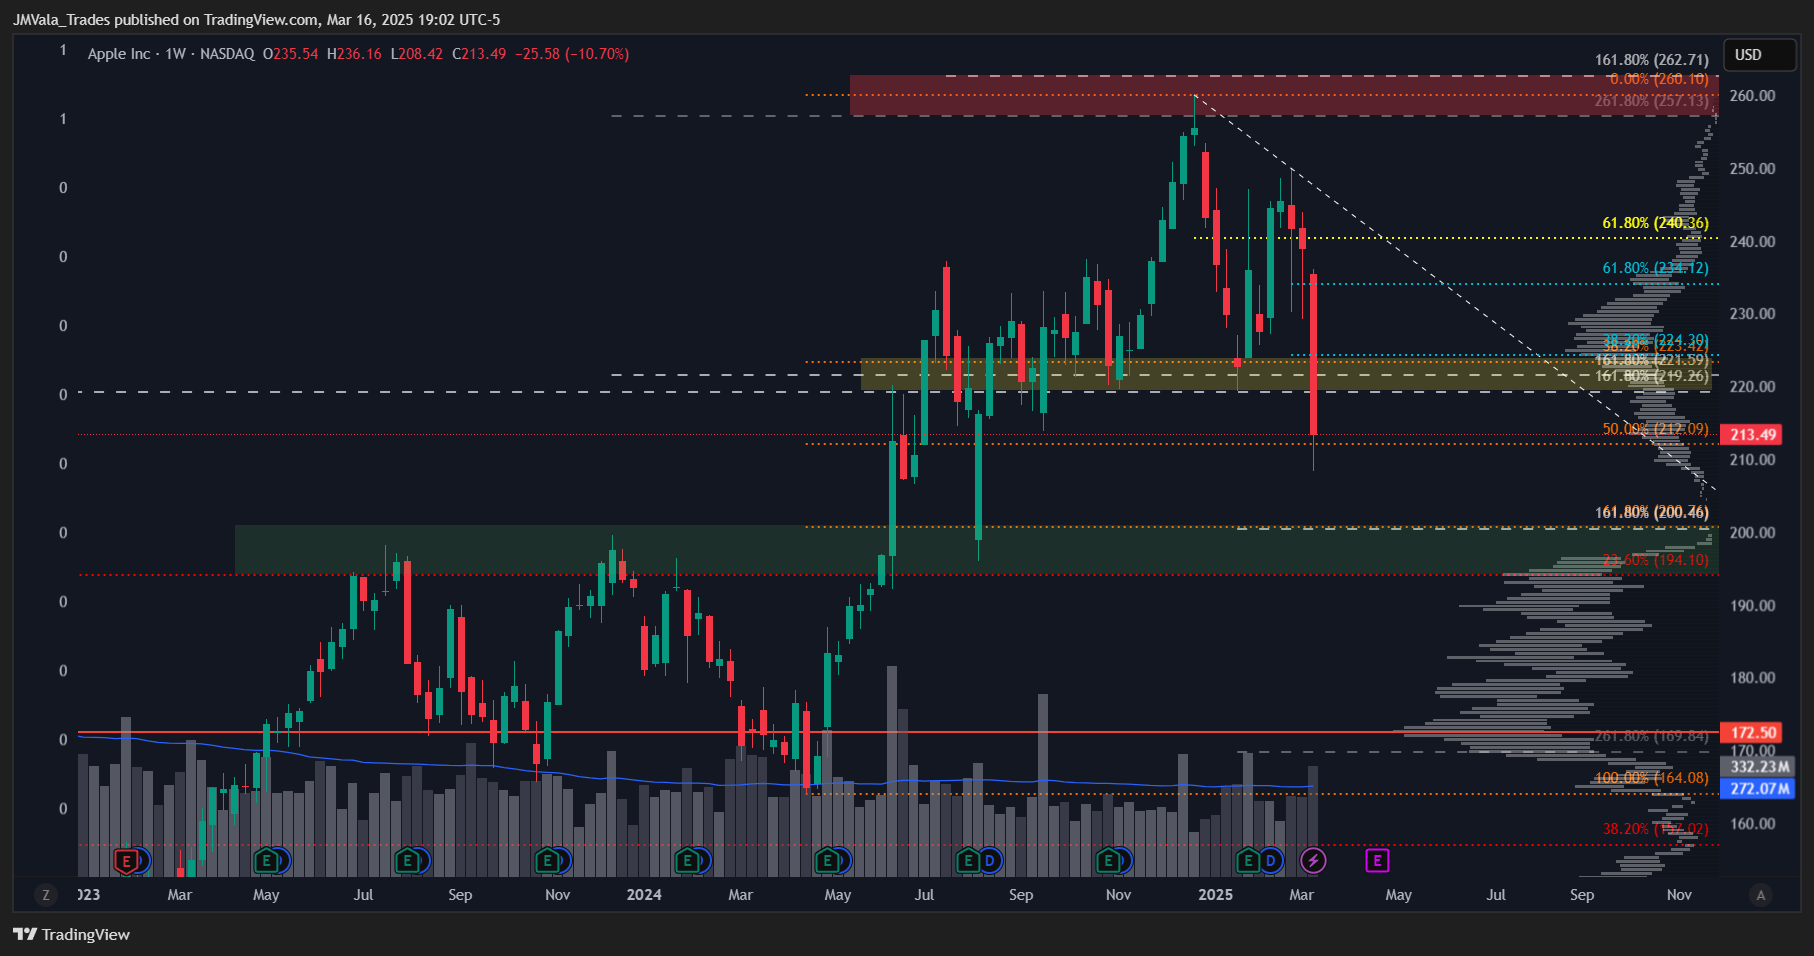
AAPL (Apple)
We needed to see Apple stick 219/223 as support and it could not do that. With the stock using the secondary 50% at 212.09, the new burden to the stock will be overcoming the previous supportive range. For the stock to be out of risk, we’ll want to see it reestablished above 224.30 now.
Should the stock move the 212.09 support and current low, the next major support structure is 194/200, where the primary 23.6% and secondary 61.8% reside, along with major volume.
MSFT (Microsoft)
Another top weight which has fallen through it’s supportive structure and upper distribution node, this time on it’s break under 407/410. Microsoft did find some support as it came into the next volume node under price of last week’s low, but I question if it’s more of a bounce, and less of a permanent bottom, just given the size of the node under price relative to the supply above. Even so, while last week’s low holds, it offers 395.6 and possibly a 407 retest.

TSLA (Tesla)
After trading some 55% lower, Tesla has finally found some footing in terms of demand at price, as it finally has made it to our longer-term buy box, after closing the gap at last week’s lows. For this to amount to anything, the stock will need to make it above the big round number in range at 250, and then that would offer a move into 302, and 320. Failure to hold this range, and last week’s low would mean the next support to test at the primary 61.8%, 187.24.

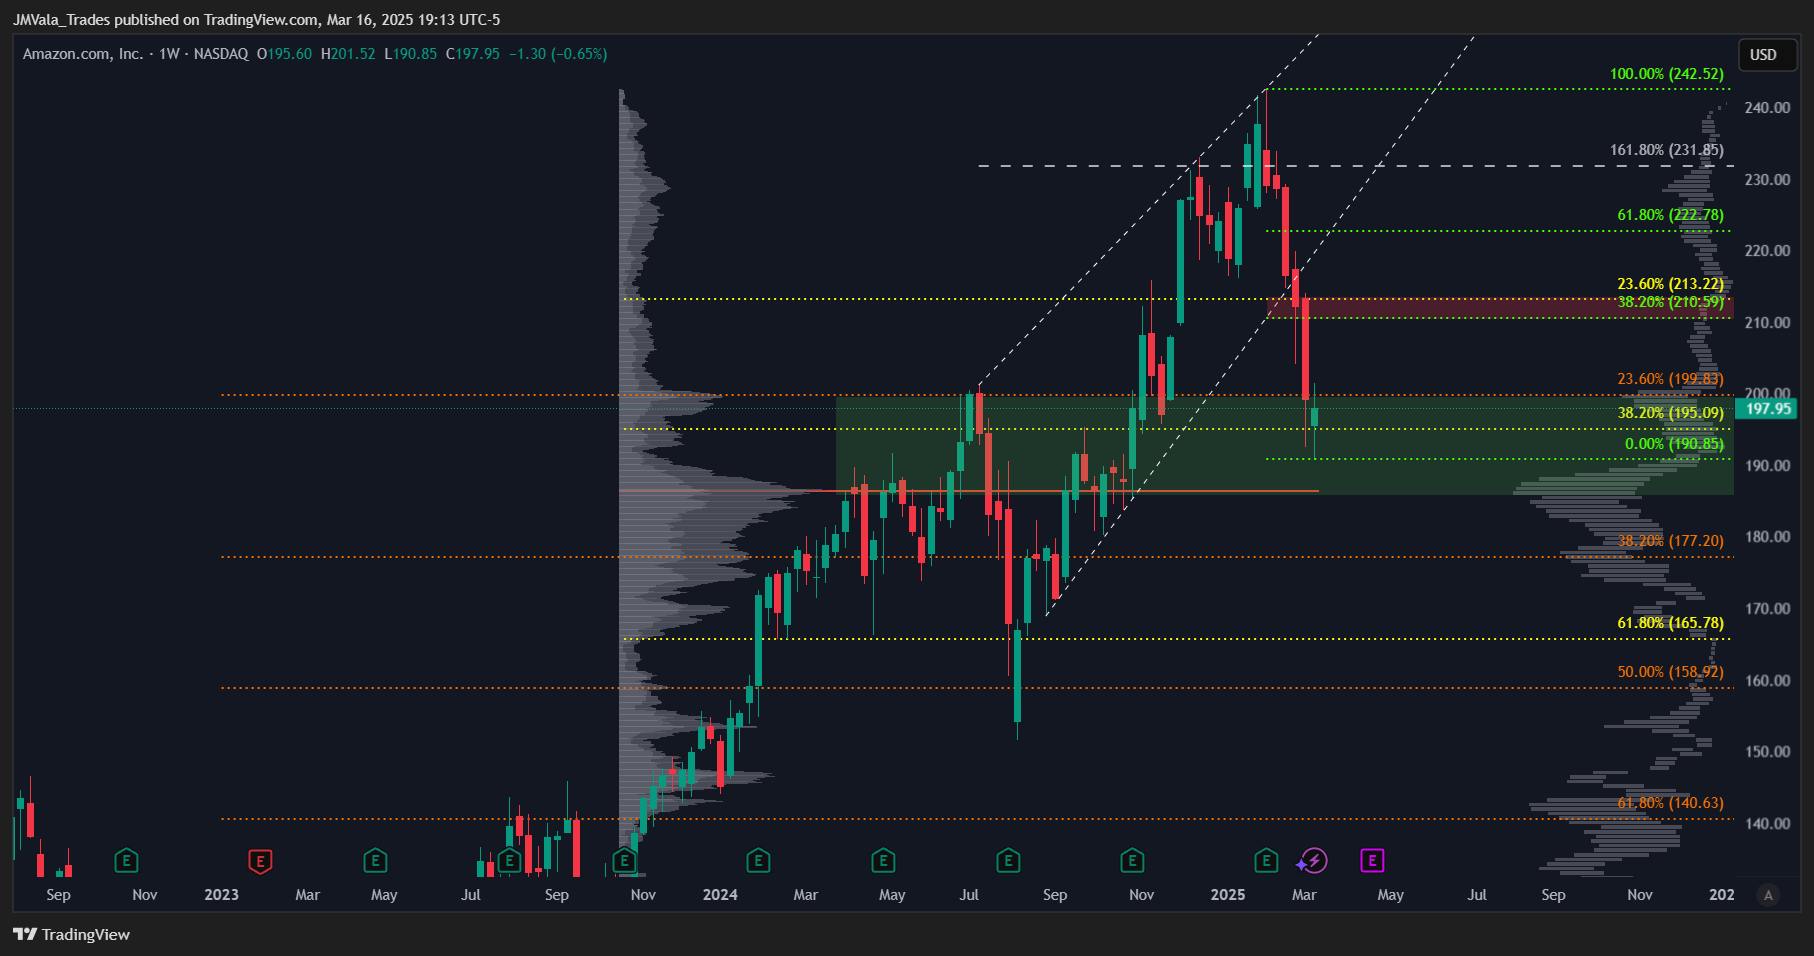
AMZN (Amazon)
Another stock which has made it into a significant demand zone. With the wekly point of control near the lows of the range at 186, to the top of the range at 199.83, the secondary 23.6%. For the stock to have any additional range, we will too need it to establish above the round number in range at 200. If it can do that, then it offers to the next resistance zone at 210-213.
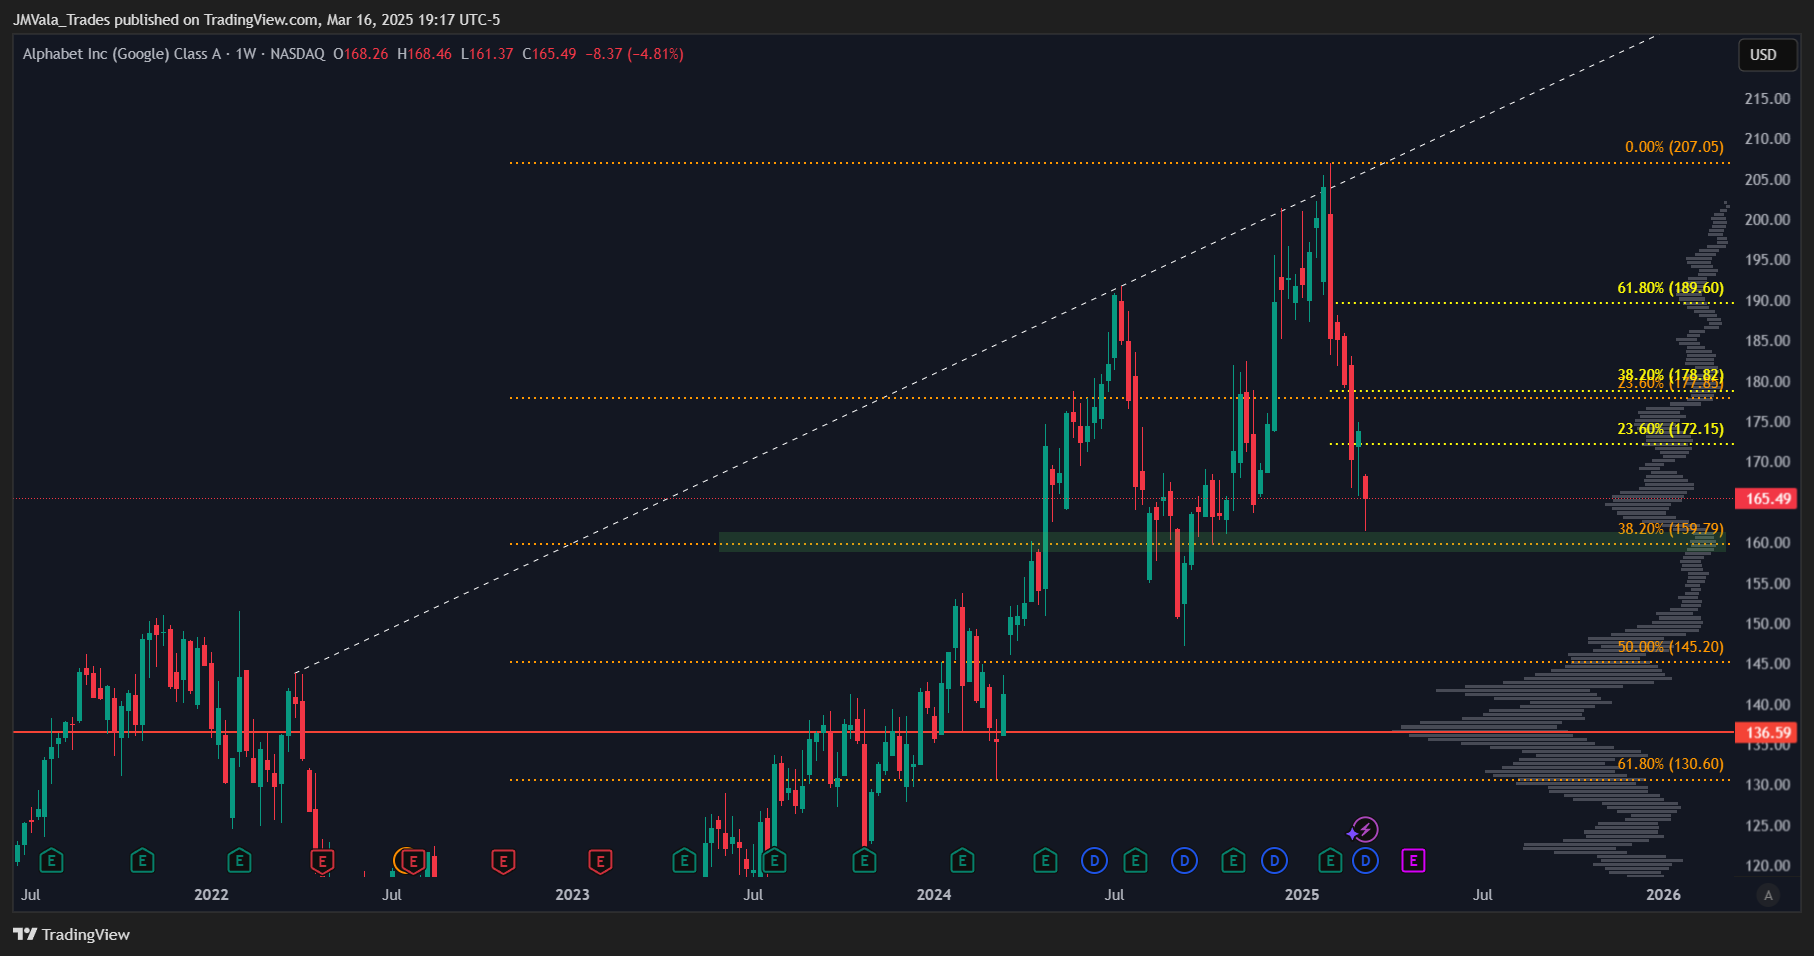
GOOGL (Google)
The stock tested down to a previous support zone near last week’s lows, just above the tertiary 38.2% at 159.79. While price holds this level, it offers to test 172.15, and potentially 178.8. Failure to hold 159.79 invokes a test of 145.20.
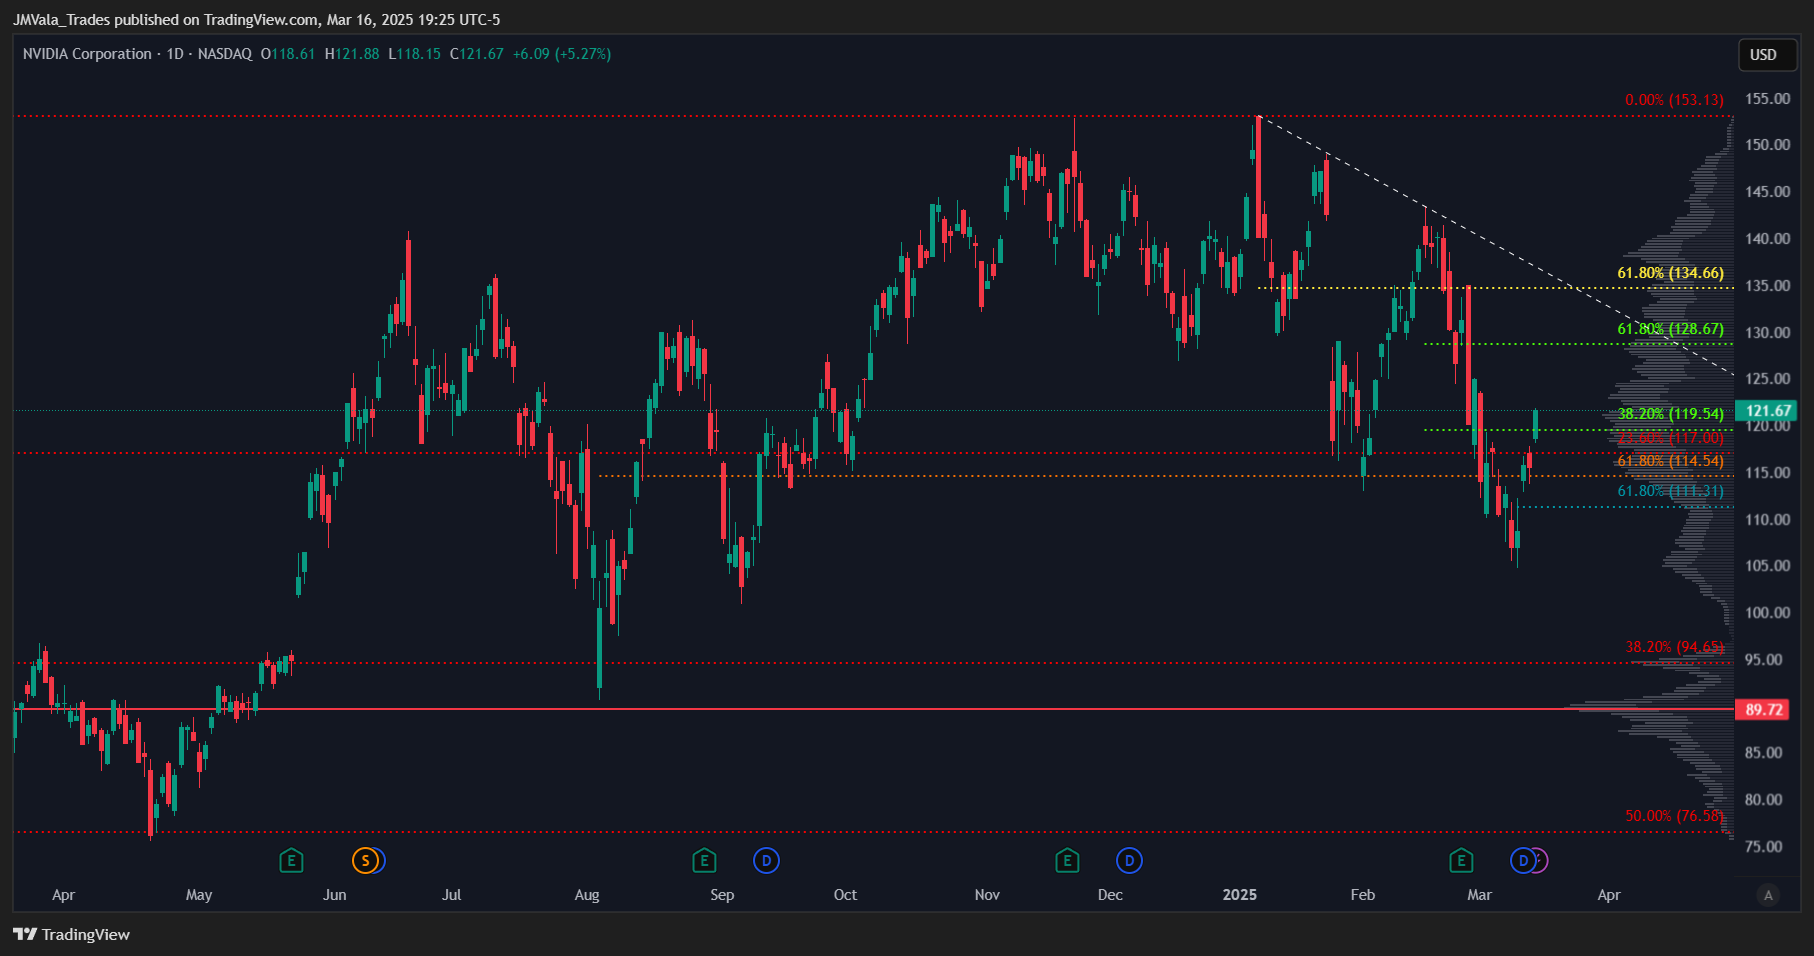
NVDA (nVidia)
After a violent move down to 105, we saw the major pivot in range at 114/117 recovered into the end of the week. While price remains above these levels, it still has the option higher to test 128.67. Failure to hold the trailing 61.8% at 111.31 offers lower to 94.65.
Closing Read
As we’ve seen above, a decent amount of top-weight stocks have come into some type of support to cause them some short-term buoyancy via demand. The question which remains is will these supportive structure tests be enough to keep the stocks out of any additional harm. In a different year, in a different market, we would say, yes, most likely. And with a put intensive opex on Friday we would expect a potential for an easier move higher after that date.
However, we know that the current environment is from any other. We are subject to not only longer-term volatility but also unknown volatility from whenever the President wants to reflect his opinions on pubic platforms. For now it is likely best to take the market day by day as opposed to week by week or longer. As mentioned above, a VIX below 19/20 would be a welcome sign. Additionally, if we were to be able to return back to a positive gamma environment, that too would help mitigate some of the risk.
Best wishes as we navigate this eventful week ahead.
Josh