

A bull flag is a chart pattern that indicates that a stock's price will continue to increase. It's a type of bullish continuation pattern that appears when a stock's price has increased sharply and then consolidated. Patterns such as triangles, rectangles, and cup and handles fit within this category.
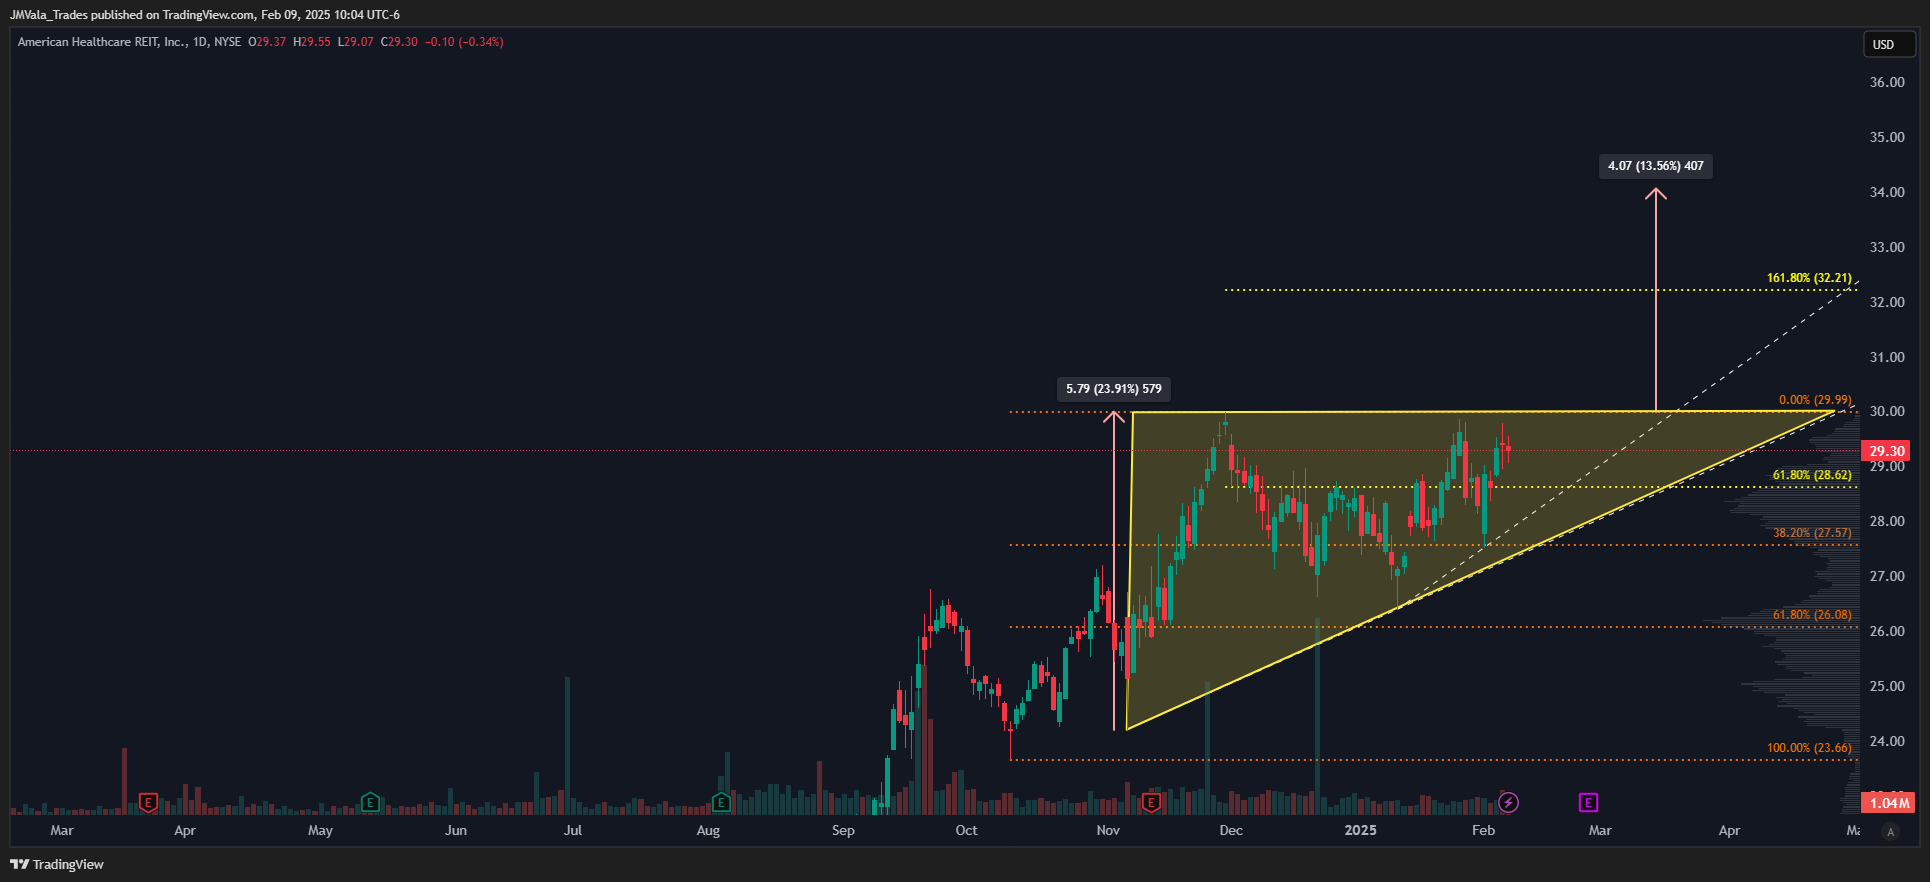
AHR (American Healthcare REIT)
Compression and uptrend near the highs since December of 2024. Technically the pattern is forming an ascending triangle. The patterns target is 4.07 above the breakout. This would set it as target 2, given that the 161.8% is at 32.21 which would act as target 1.
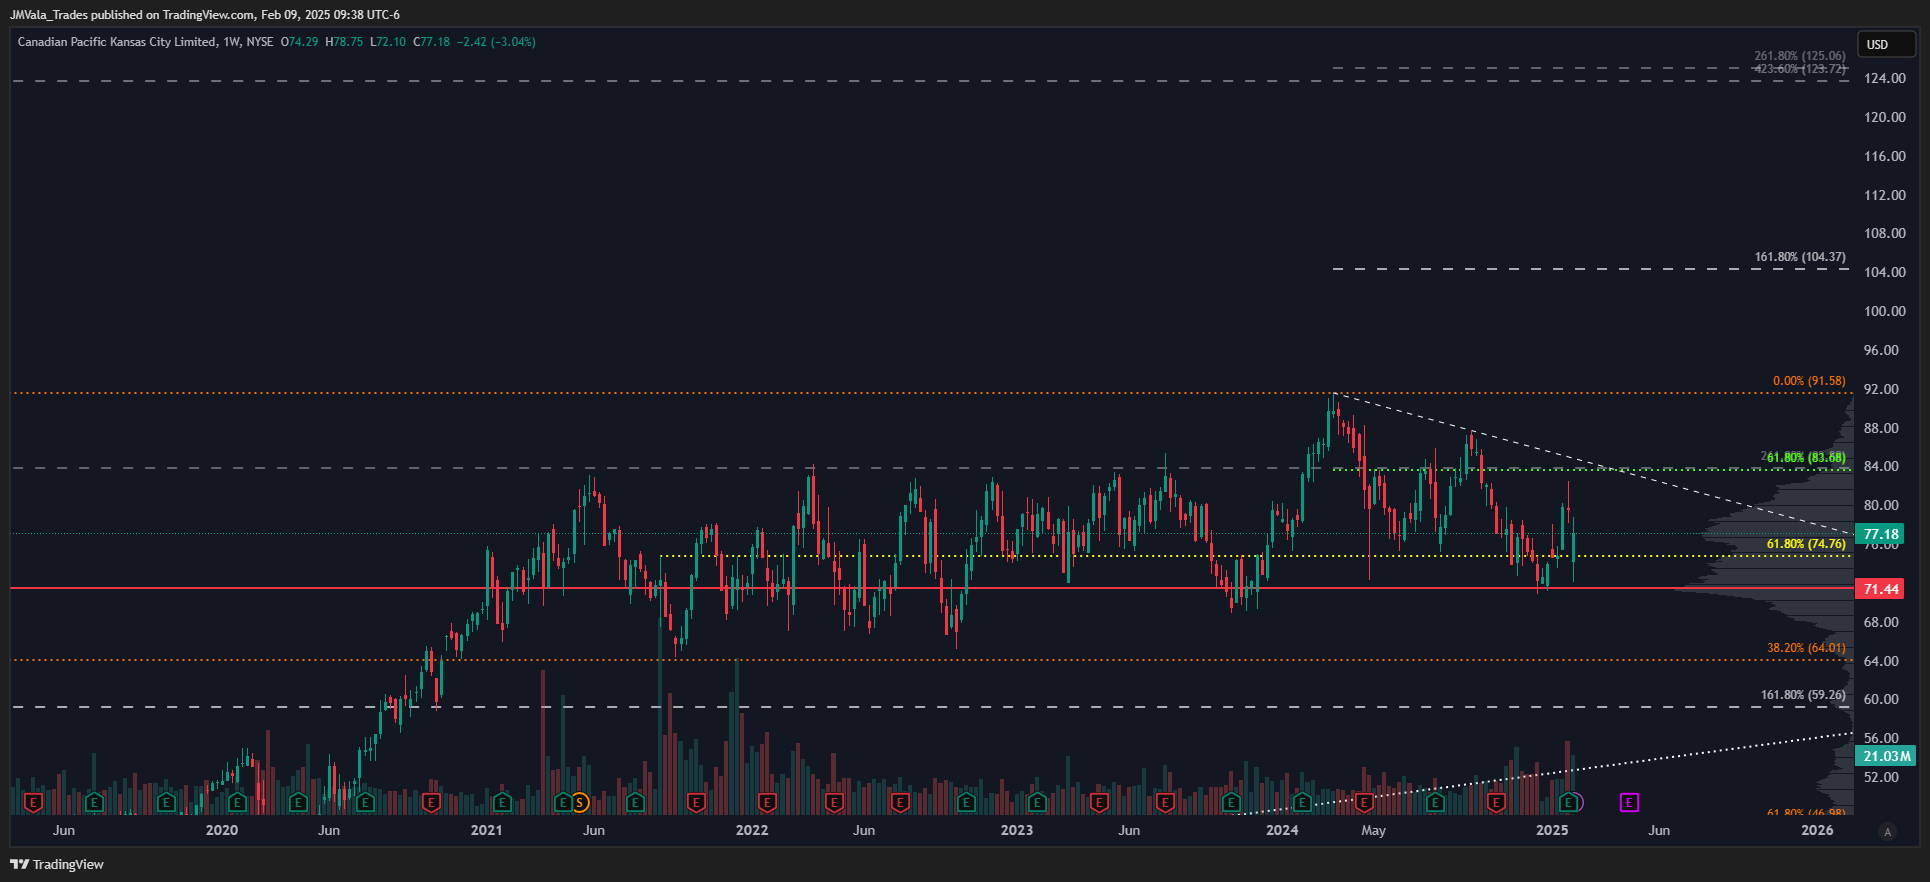
CP (Canadian Pacific)
The stock has been consolidating since 2021 in a tight range, with the multi-year POC under price at 71.44. Ultimately, I’d like to see a move above the 84.00 area to signal that a new trend may be starting. Elsewise, the stock is subject to continued consolidation until there is a catalyst. The extensions above serve as targets: 104.37 and 123/125.
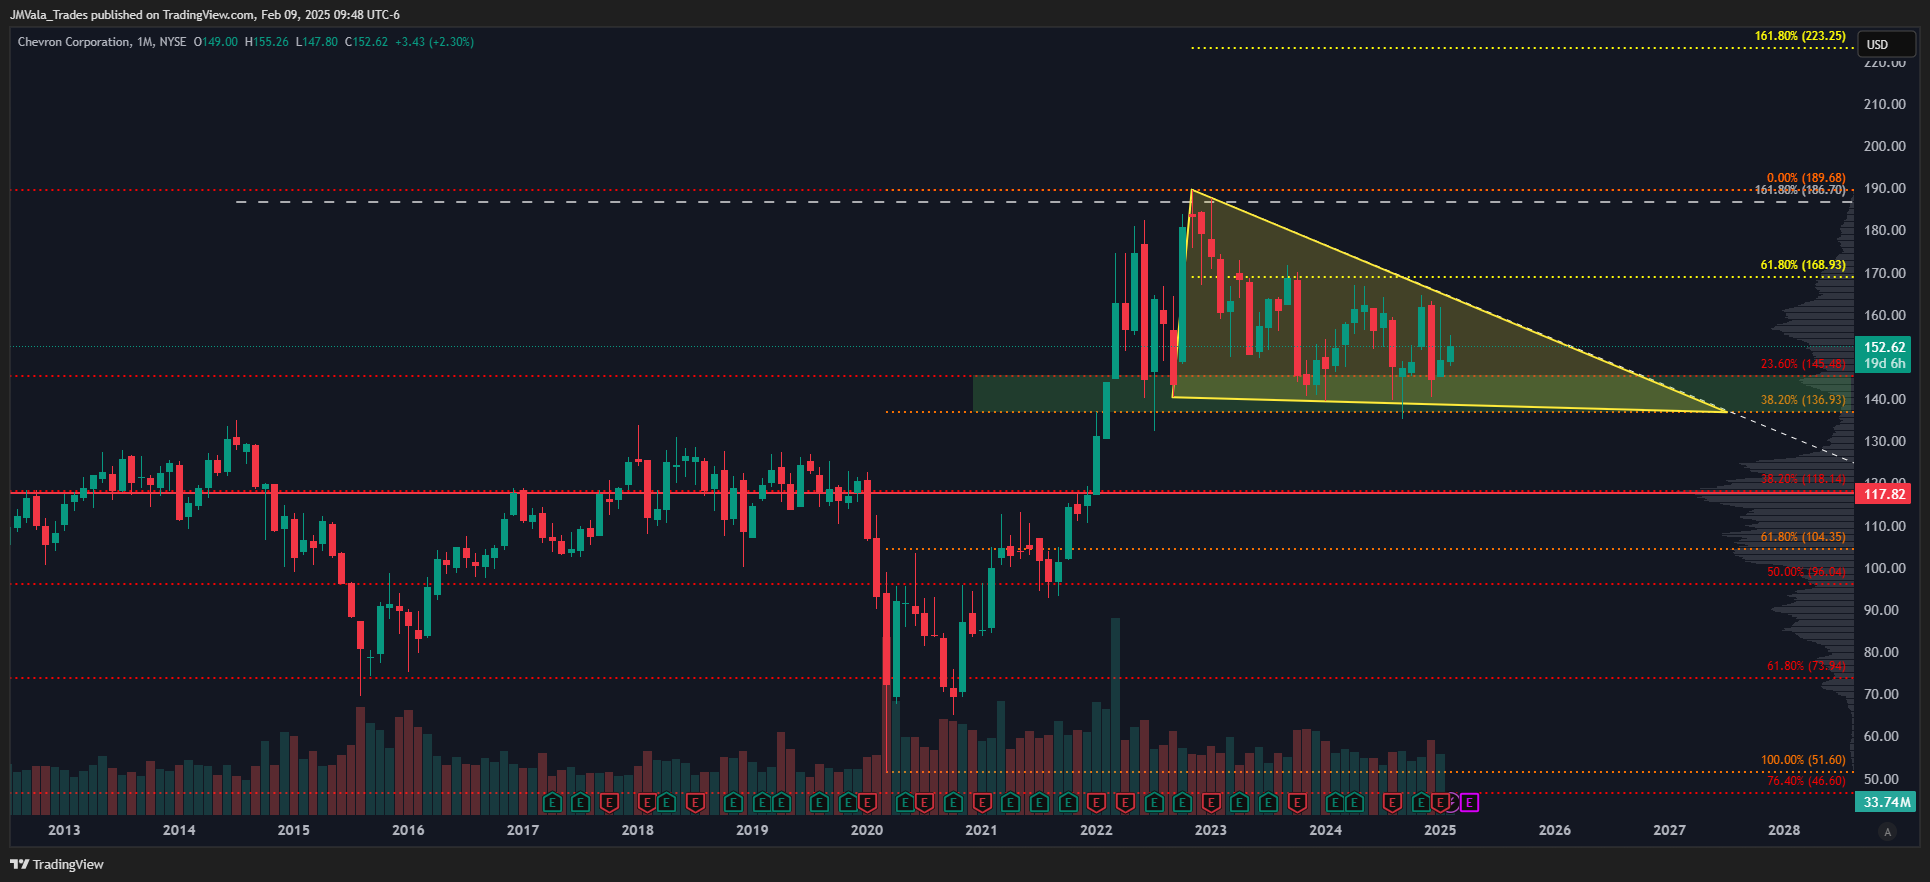
CVX (Chevron)
Chevron has been consolidating in a high tight flag since mid 2022. Currently the stock is set up as a descending triangle. Oddly enough, these types of triangles have a propensity to break up and out more often than down. The pattern itself has not yet reached the maturity where we would expect a breakout, but it’s worth setting some alerts. Technically, we’d think the breakout would come closer to summer. The pattern suggests a move of $31 once the downtrend breaks.
Again, the 61.8% at 168.93 should still be respected as resistance first. Also, given the amount of time this has consolidated, I would not be shocked to see price advance higher than the $31, and instead would think the final target should be closer to the 161.8% extension at 223.25.
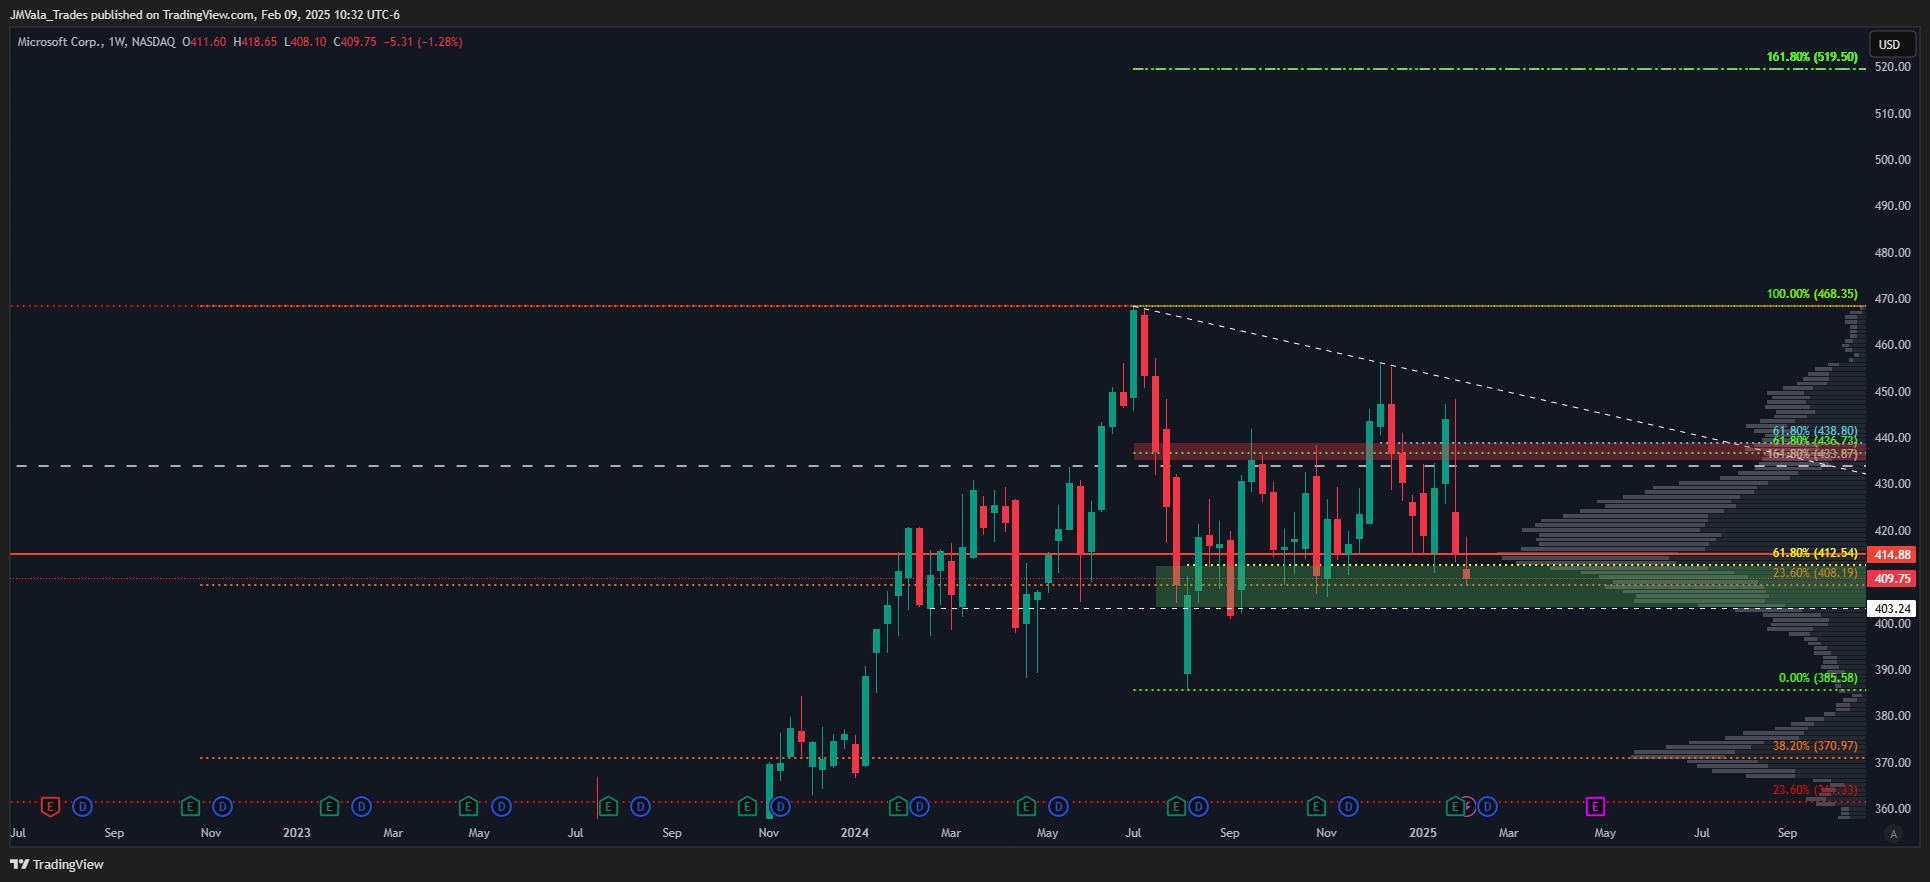
MSFT (Microsoft)
Our good friend Microsoft also fits into this category, as it has gone almost nowhere since early 2024. The volume profile is gaussian, meaning it’s developed symmetrically, with no bias to either side. For this stock, we’d want to see the 439 level acting as support, which would then offer a break of the downtrend, then 468.35 and 519.50.
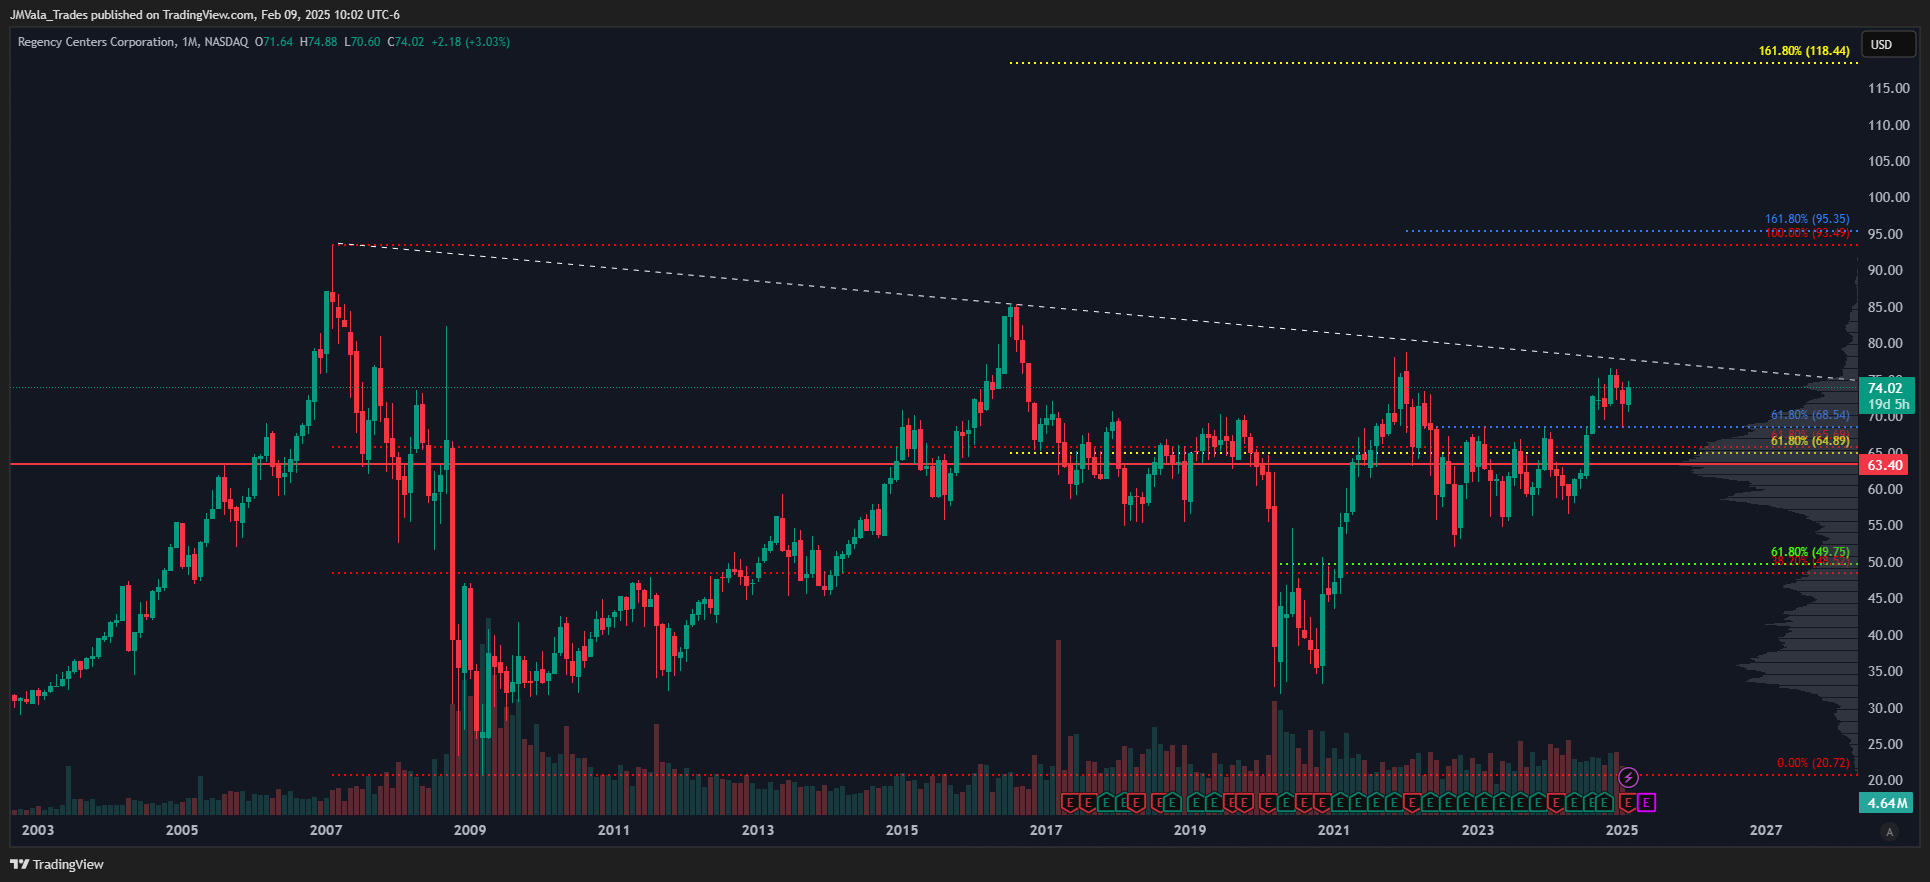
REG (Regency Centers)
The chart below is a monthly time frame, just to underscore the amount of compression on this chart. One could say that it’s kind of an inverse head and shoulders if you squint, but I’d rather just call it consolidation. At any rate, while price remains above 64.89/68.54, the compression should eventually break higher, with targets at the previous all-time high of 93.49, then 118.44, and 138.46. Like the others there is no way to know when the compression will give, but this one is set up very well.
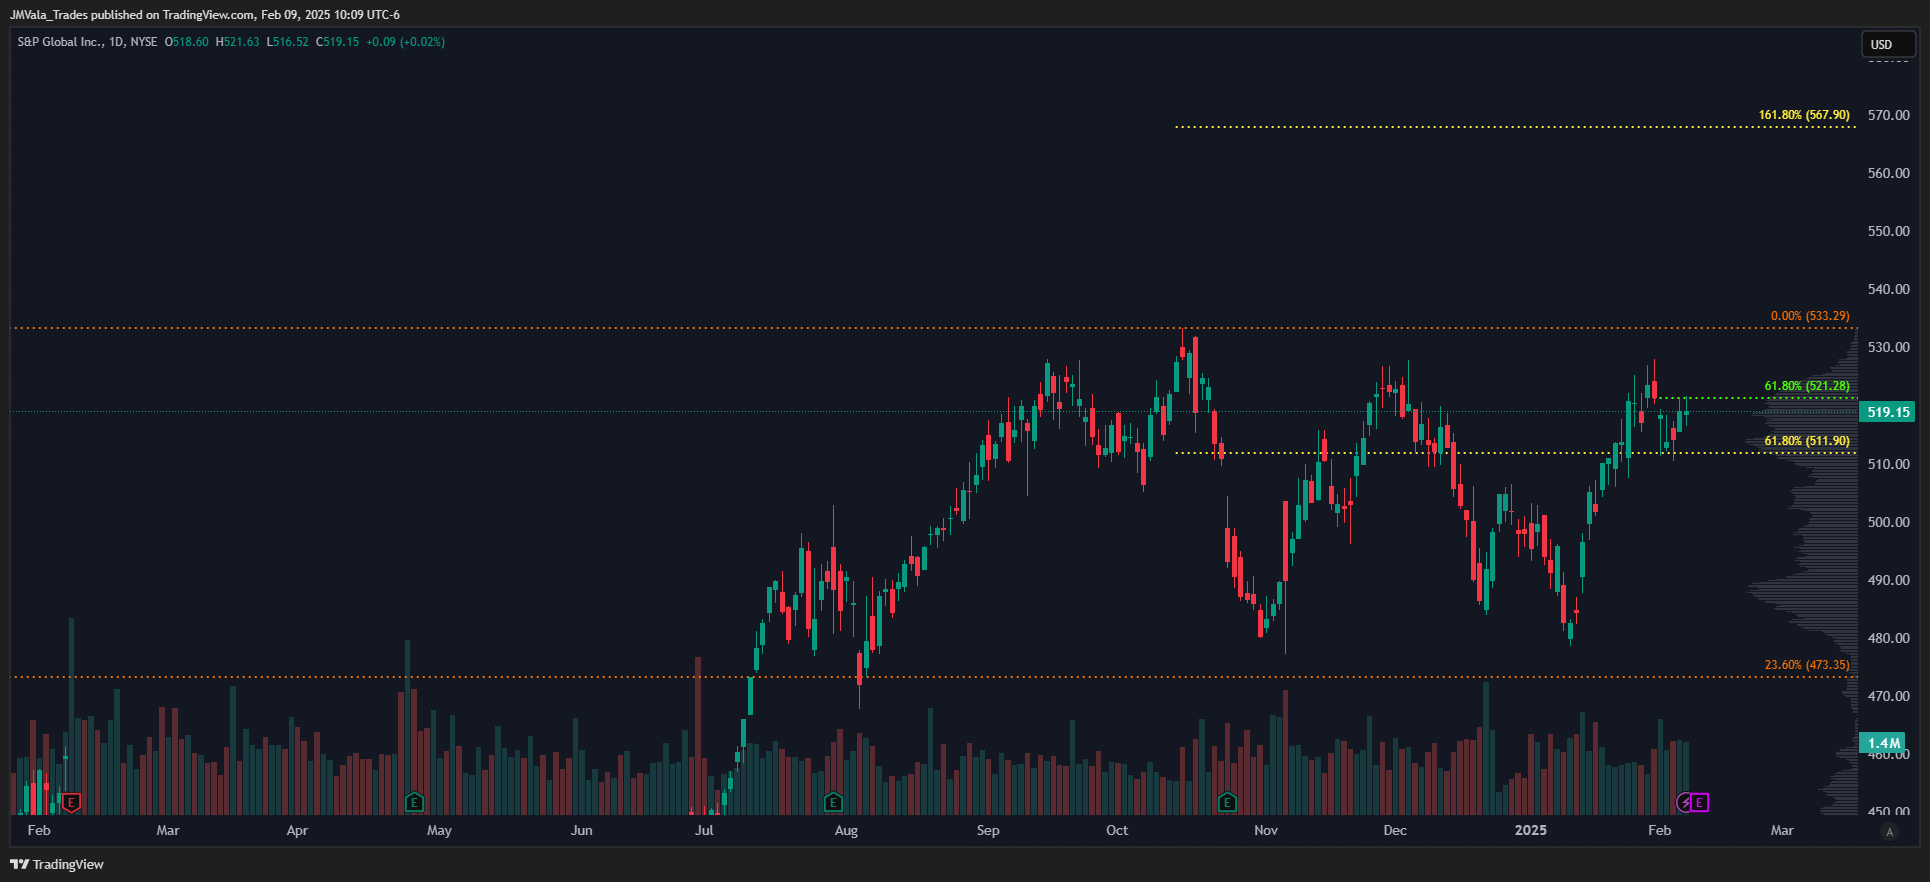
SPGI (S&P Global)
This stock has not been consolidating as long as the previous stocks, but it is still forming the largest node of volume on the chart between 511.90-521.28. A break of this upper level would offer to 533.29, and then 567.90.
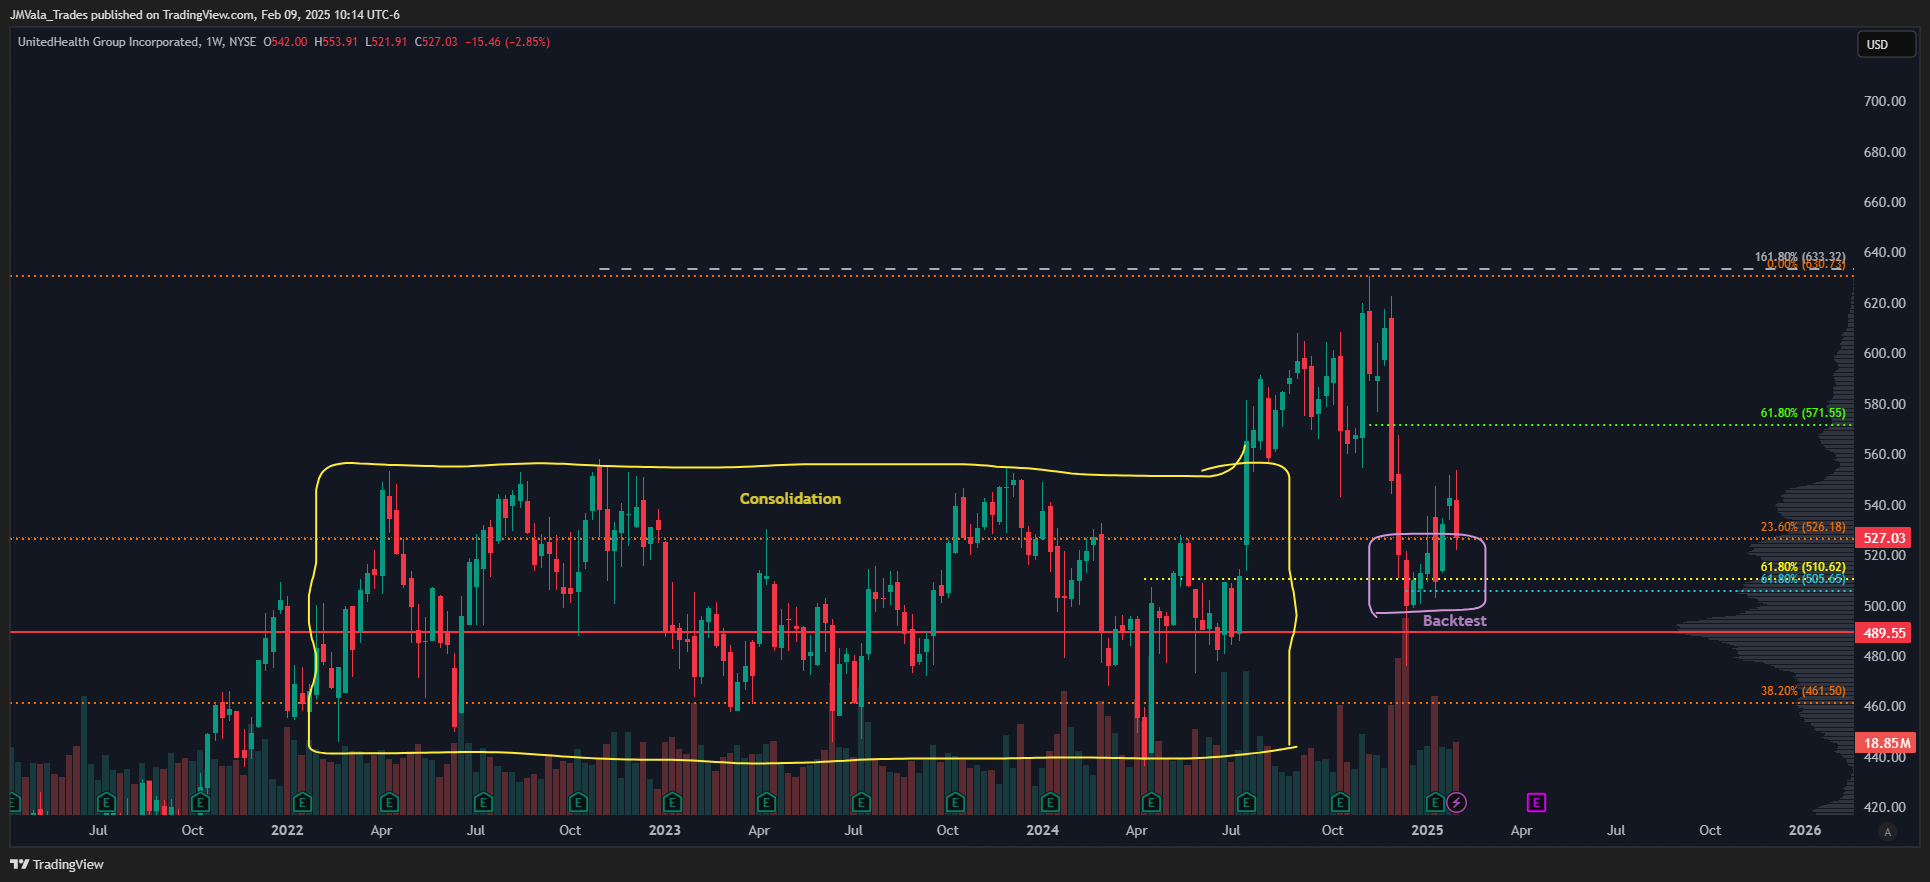
UNH (UnitedHealth)
After consolidating from 2022-Mid 2024, the stock attempted to breakout to new highs but was stifled by the extension at 633.32. From there, as is normal, price had to explore for demand, which it found where it was needed, on the backtest of the point of control of the consolidative node, as well as, the 61.8% of the cycle, near 490/510.
From here, we would want to see 526.18 remain as support to offer back to 571.55. Resistance 1 comes from the 61.8% at that price, and it’s also the high of the previous consolidative range, so we may see a temporary pause and consolidation there, but over that price point offers again to the all-time high, some 20% above current pricing.
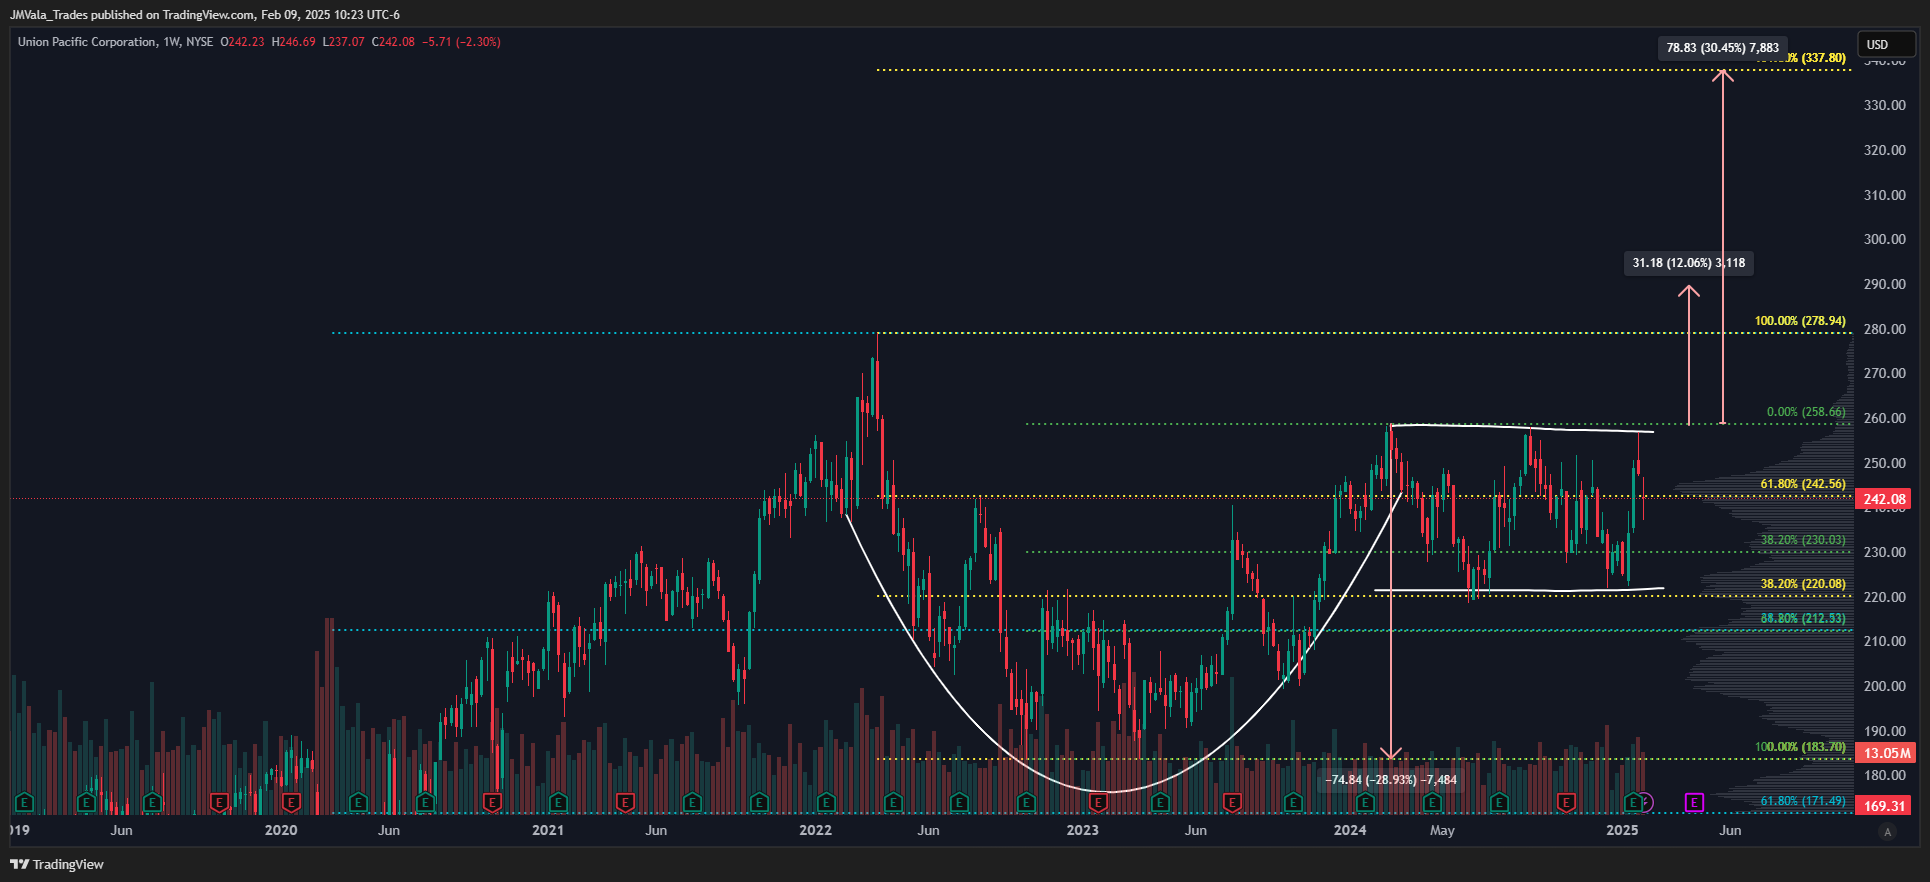
UNP (Union Pacific)
Presenting as a cup and handle on the weekly chart, the stock is currently still building out the handle of the pattern. R/r wise, entry long can be taken on 242.56 support or the 258.66 breakout. While the target for the cup and handle is only around 31 points from the breakout at 290, I would think, given the time of consolidation here, we’d think about pricing closer to the 161.8% up at 337.80.
Final Words
There are over 8,000 optionable stocks, and so many others with consolidative patterns near the higher end of ranges. The ones above were farmed from the upper end of the Market Cap list on my scans, but it would be logical to do the same on stocks that don’t meet this market cap restriction.
The next Substack will be focused on consolidative bottoms showing positive divergences.
Have a great week ahead,
Josh